Create a real time line graph in Android with AChartEngine
AChartEngine is one of the oldest library available to create graph on Android. Solution is functional but lacks of some fresh in front of new libraries that implement Material Design specifications. However, it’s interesting to study it to learn how to create real time line graph with it.
First, we need to get AChartEngine. It can be downloaded as a single jar here in version 1.2.0 : http://repository-achartengine.forge.cloudbees.com/snapshot/org/achartengine/achartengine/1.2.0/ . You can also use it as a Maven dependency if you use Maven to build your Android project.
Once you will have created an Android application project, add achartengine-1.2.0.jar file in libs folder. Now, your project is ready to use AChartEngine library.
Design a Point
First, we’re going to design a 2D point into a Point class like this :
public class Point {

 private static final Random RANDOM = new Random();
 public int x;
 public int y;

 public Point(int x, int y) {
   this.x = x;
   this.y = y;
 }

 public static Point randomPoint(int x) {
   return new Point(x, RANDOM.nextInt(40));
 }

}
We add a randomPoint static method to get the possibility to generate random points giving a x coordinate. The y coordinate is random between 0 and 39 because in our tutorial, we’re going to display temperature in degrees.
Line Graph class
Main part of the real time line graph is to design a LineGraph class to represent this object. With AChartEngine, we’re going to use a TimerSeries object for x values and add this in a XYMultipleSeriesDataset because we have also y values. Rendering operation is well separated with AChartEngine and we must use a XYSeriesRenderer and a XYMultipleSeriesRenderer objects to display the graph to the screen. All these objects are then passed in parameters to create the GraphicalView.
Code is like that :
import org.achartengine.ChartFactory;
import org.achartengine.GraphicalView;
import org.achartengine.chart.PointStyle;
import org.achartengine.model.TimeSeries;
import org.achartengine.model.XYMultipleSeriesDataset;
import org.achartengine.renderer.XYMultipleSeriesRenderer;
import org.achartengine.renderer.XYSeriesRenderer;

import android.content.Context;
import android.graphics.Color;
import android.graphics.Typeface;

public class LineGraph {

 private TimeSeries data = new TimeSeries("Temperature");
 private XYMultipleSeriesDataset multiData = new XYMultipleSeriesDataset();
 private XYSeriesRenderer renderer = new XYSeriesRenderer();
 private XYMultipleSeriesRenderer multiRenderer = new XYMultipleSeriesRenderer();
 private GraphicalView view;

 public LineGraph() {
   // add data
   multiData.addSeries(data);

   // customize
   renderer.setColor(Color.BLACK);
   renderer.setPointStyle(PointStyle.CIRCLE);
   renderer.setFillPoints(true);

   // Enable zoom
   multiRenderer.setZoomButtonsVisible(true);
   multiRenderer.setXTitle("Day #");
   multiRenderer.setYTitle("Temperature");
   multiRenderer.setXLabelsColor(Color.RED);
   multiRenderer.setYLabelsColor(0, Color.RED);
   multiRenderer.setTextTypeface(Typeface.DEFAULT_BOLD);
   multiRenderer.setAxisTitleTextSize(16);

   // add single renderer to multiple
   multiRenderer.addSeriesRenderer(renderer);
 }

 public GraphicalView getView(Context context) {
   view = ChartFactory.getLineChartView(context, multiData, multiRenderer);
   return view;
 }

 public void addNewPoints(Point p) {
   data.add(p.x, p.y);
 }

}
Here, you can note the addNewPoints method that takes a Point object in parameter and add in the dataset. This method will be useful to add new data when we will simulate real time add of data for the line graph.
Main Activity
Now that we have all the elements to create the line graph, we can go on the main activity and make the real time feature thanks to a Thread :
import org.achartengine.GraphicalView;

import android.app.Activity;
import android.os.Bundle;

public class MainActivity extends Activity {

 private GraphicalView graphView;
 private LineGraph lineGraph;

 @Override
 protected void onCreate(Bundle savedInstanceState) {
   super.onCreate(savedInstanceState);
   lineGraph = new LineGraph();
   graphView = lineGraph.getView(this);
   setContentView(graphView);
 }

 @Override
 protected void onResume() {
   super.onResume();

   // here add just 40 values
   new Thread(new Runnable() {

     @Override
     public void run() {
       for (int i = 0; i < 40; i++) {
       final int x = i;

       runOnUiThread(new Runnable() {

         @Override
         public void run() {
           lineGraph.addNewPoints(Point.randomPoint(x));
           graphView.repaint();
         }
       });

       try {
         Thread.sleep(600);
       } catch (InterruptedException e) {
         // manage error ...
       }
     }
    }
   }).start();

  }

}
Don’t forget to make repaint of the GraphicalView in the UI Thread thanks to a call at runOnUiThread in the separate Thread to avoid problems.
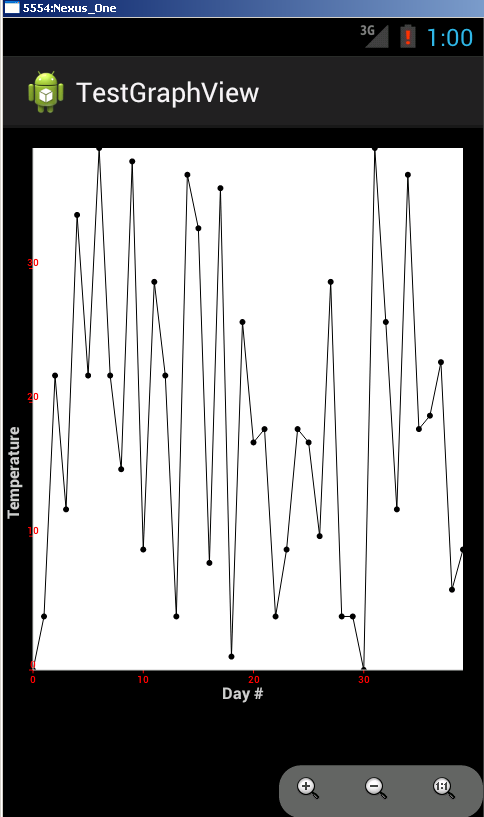
Result is functional but needs surely some UI improvements :
To see details of the tutorial in video, watch the Youtube live coding video :
Demo of the final result is here :


Leave a Reply
You must be logged in to post a comment.