Learn How to Create an Interactive Map of India Using HTML5/JavaScript and SVG
Ever heard of SVG? This acronym may not mean anything to you, but it’s an essential format to master if you want to use vector graphics on Web pages. SVG stands for Scalable Vector Graphics. SVG is an XML-based ASCII data format designed to describe vector graphics.
SVG is specified by the World Wide Consortium and has been around since 1998. Even if you’re not familiar with SVG, it’s widely used in the world of cartography and cell phones.
To learn how to use some of the immense potential of the SVG format, we’re going to focus on the field of cartography. In this step-by-step tutorial, I’ll show you how to create an interactive map of India using the infernal Web couple HTML5 and JavaScript, but also the SVG format.
How will our map of India be interactive?
Our map of India will have two main functionalities. The first will be to display each region of India in a different color according to its population. The second will respond to the user’s mouse hover to display the name of the region in question.
Please note that this tutorial can be applied to any other country in the world.
All you need is an SVG representation of the country or continent you wish to display to users. You can create your maps in SVG format using software such as Inkscape, or you can simply find SVG maps on the Internet with a simple Google search.
As the aim of this tutorial is not to create a map in SVG format ourselves, but rather to use it, I’ve limited myself to downloading such a map.
Displaying the SVG map in an HTML page
The first step is to integrate our SVG map of India into an HTML page. You could import it using the object tag, but then you wouldn’t be able to apply CSS styles to it from your HTML page.
The best thing to do here is to integrate the SVG directly into our HTML page, which gives us the following code:
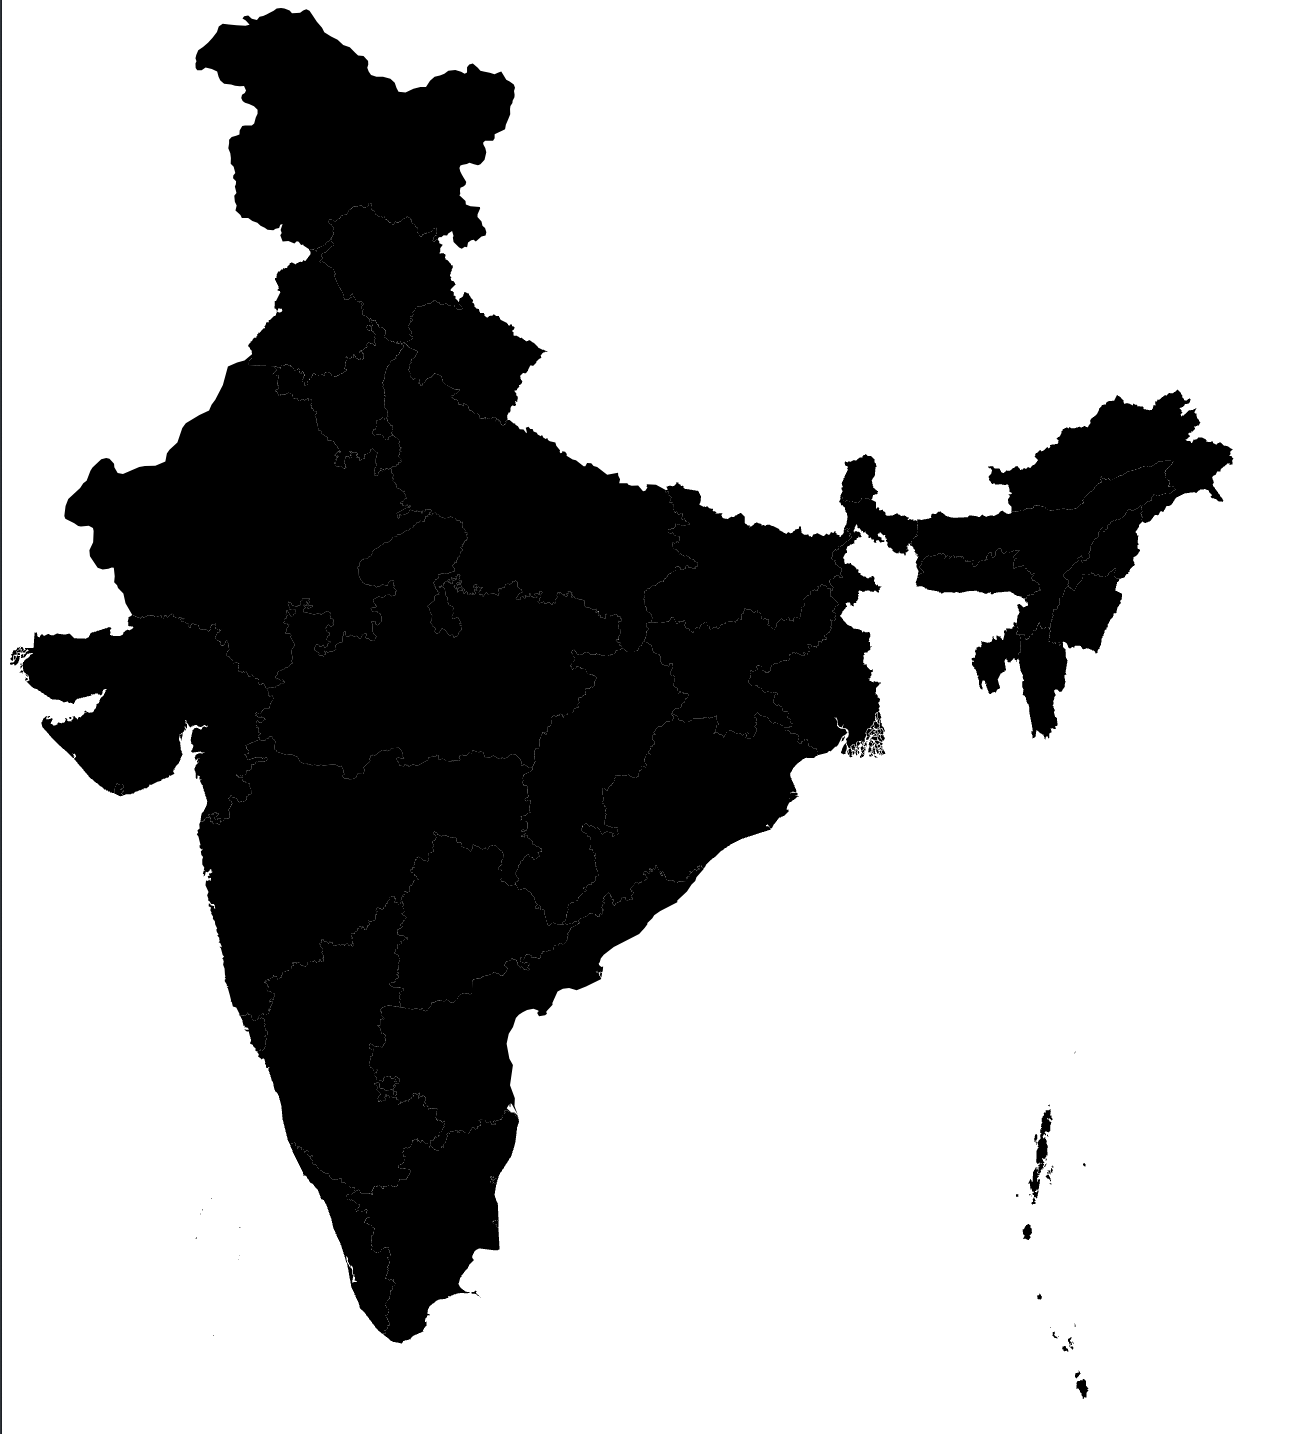
Nothing extraordinary here, since the map is displayed in black only. But the magic of SVG is that we can then apply styles to the various SVG paths we’ve placed on our Web page.
Enhancing the SVG of our Web page with other geometric shapes
We’re now going to enhance our SVG by adding a title and legend for the population data. We’re going to classify the population by regions of India according to 6 major classes: > 200M, 100-200M, 50-100M, 10-50M, 1-10M, < 1M.
This legend will also show you how to use some of the graphic primitives of the SVG format to draw a rectangle or write text.
This gives us the following code:
You will get the following result on your browser:
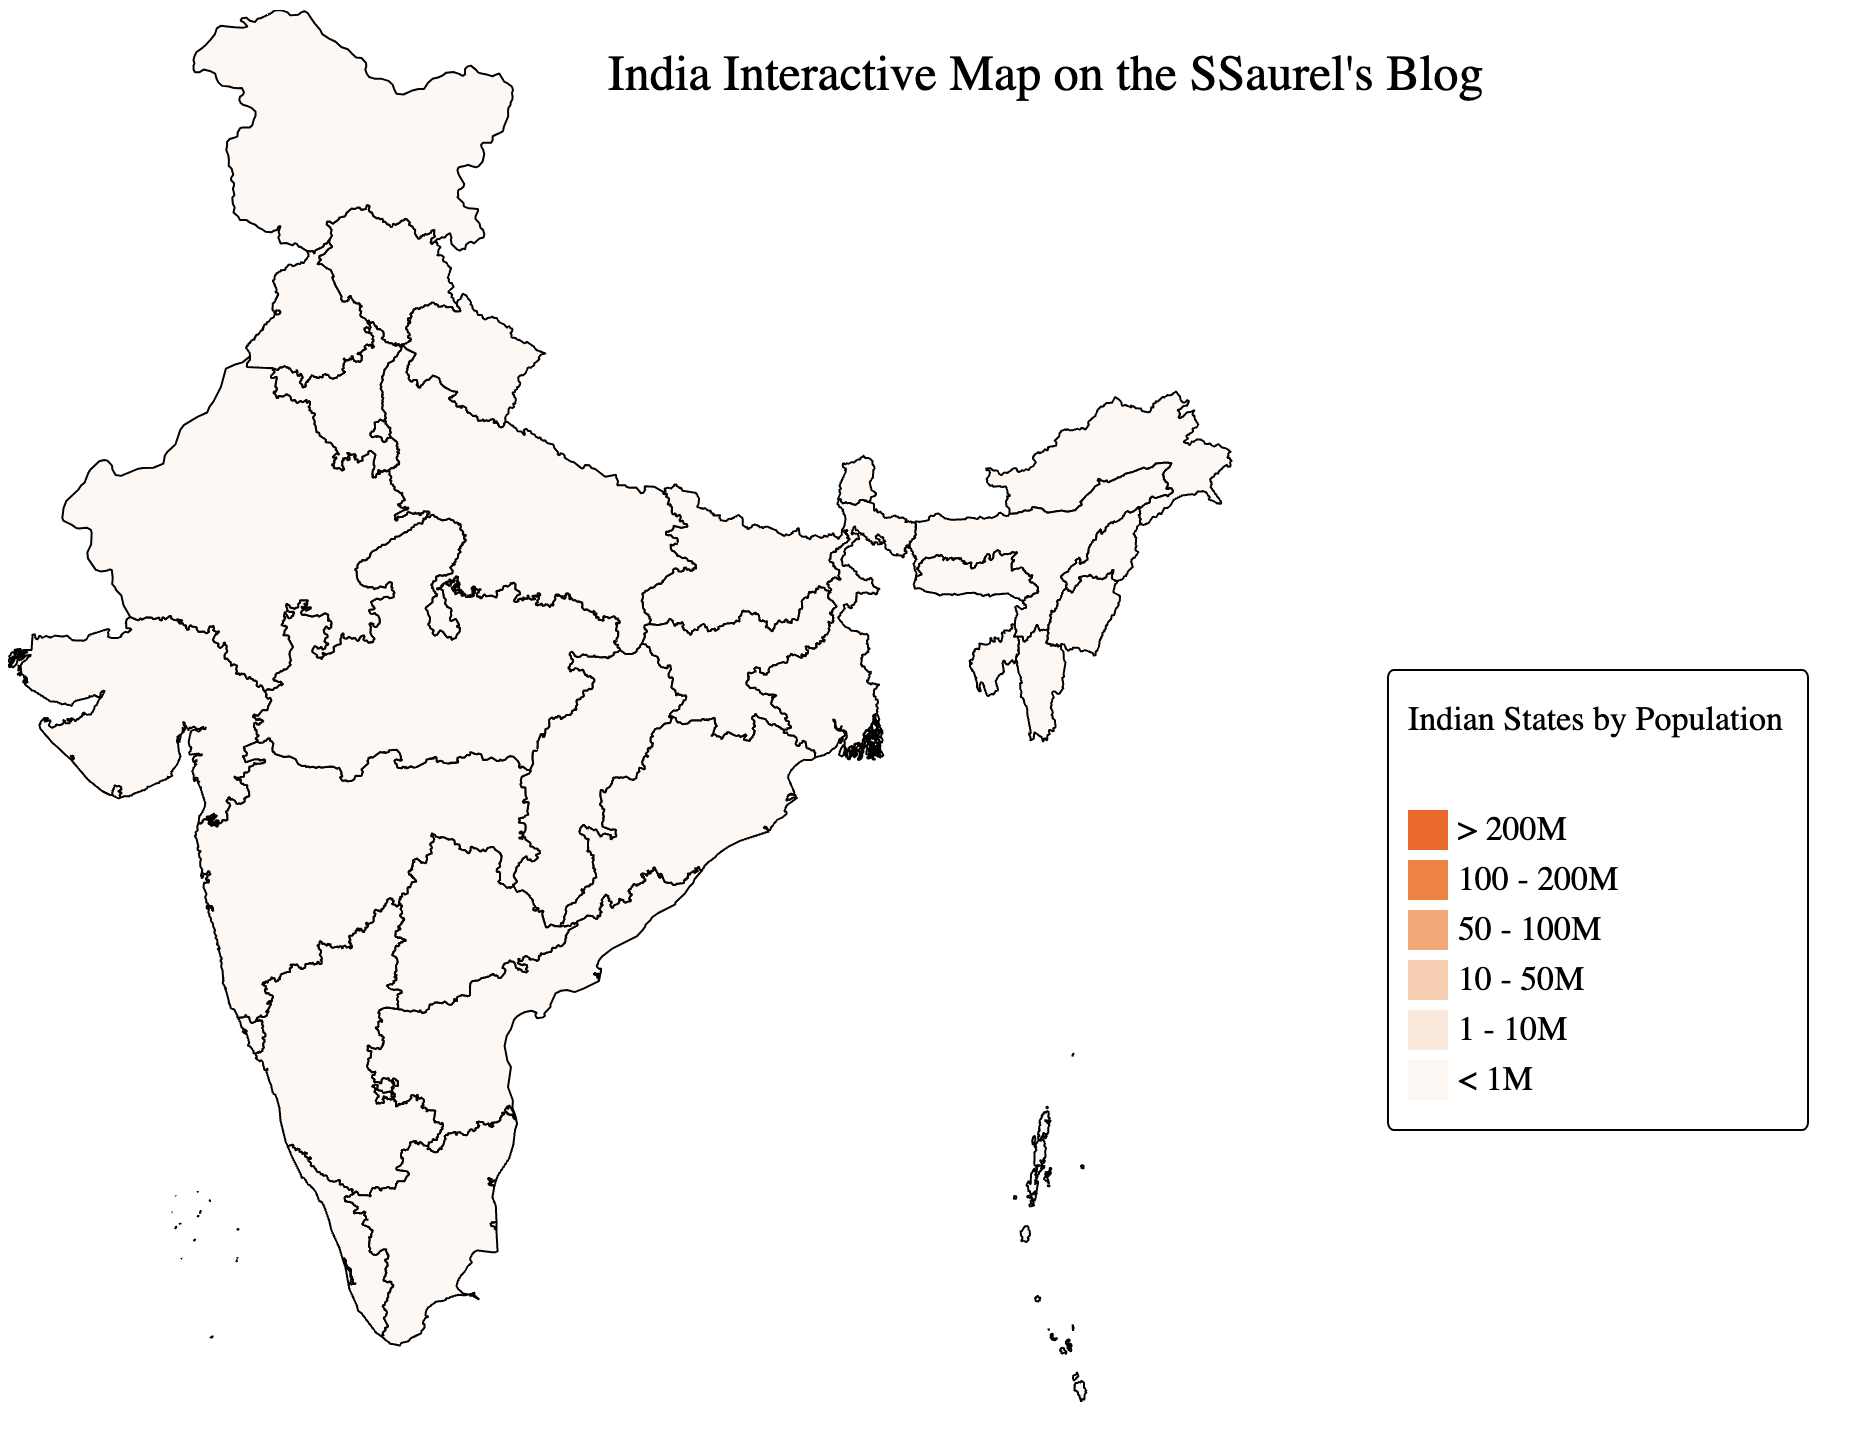
Rather nice, isn’t it?
Add interactivity to our map of India in SVG format using JavaScript
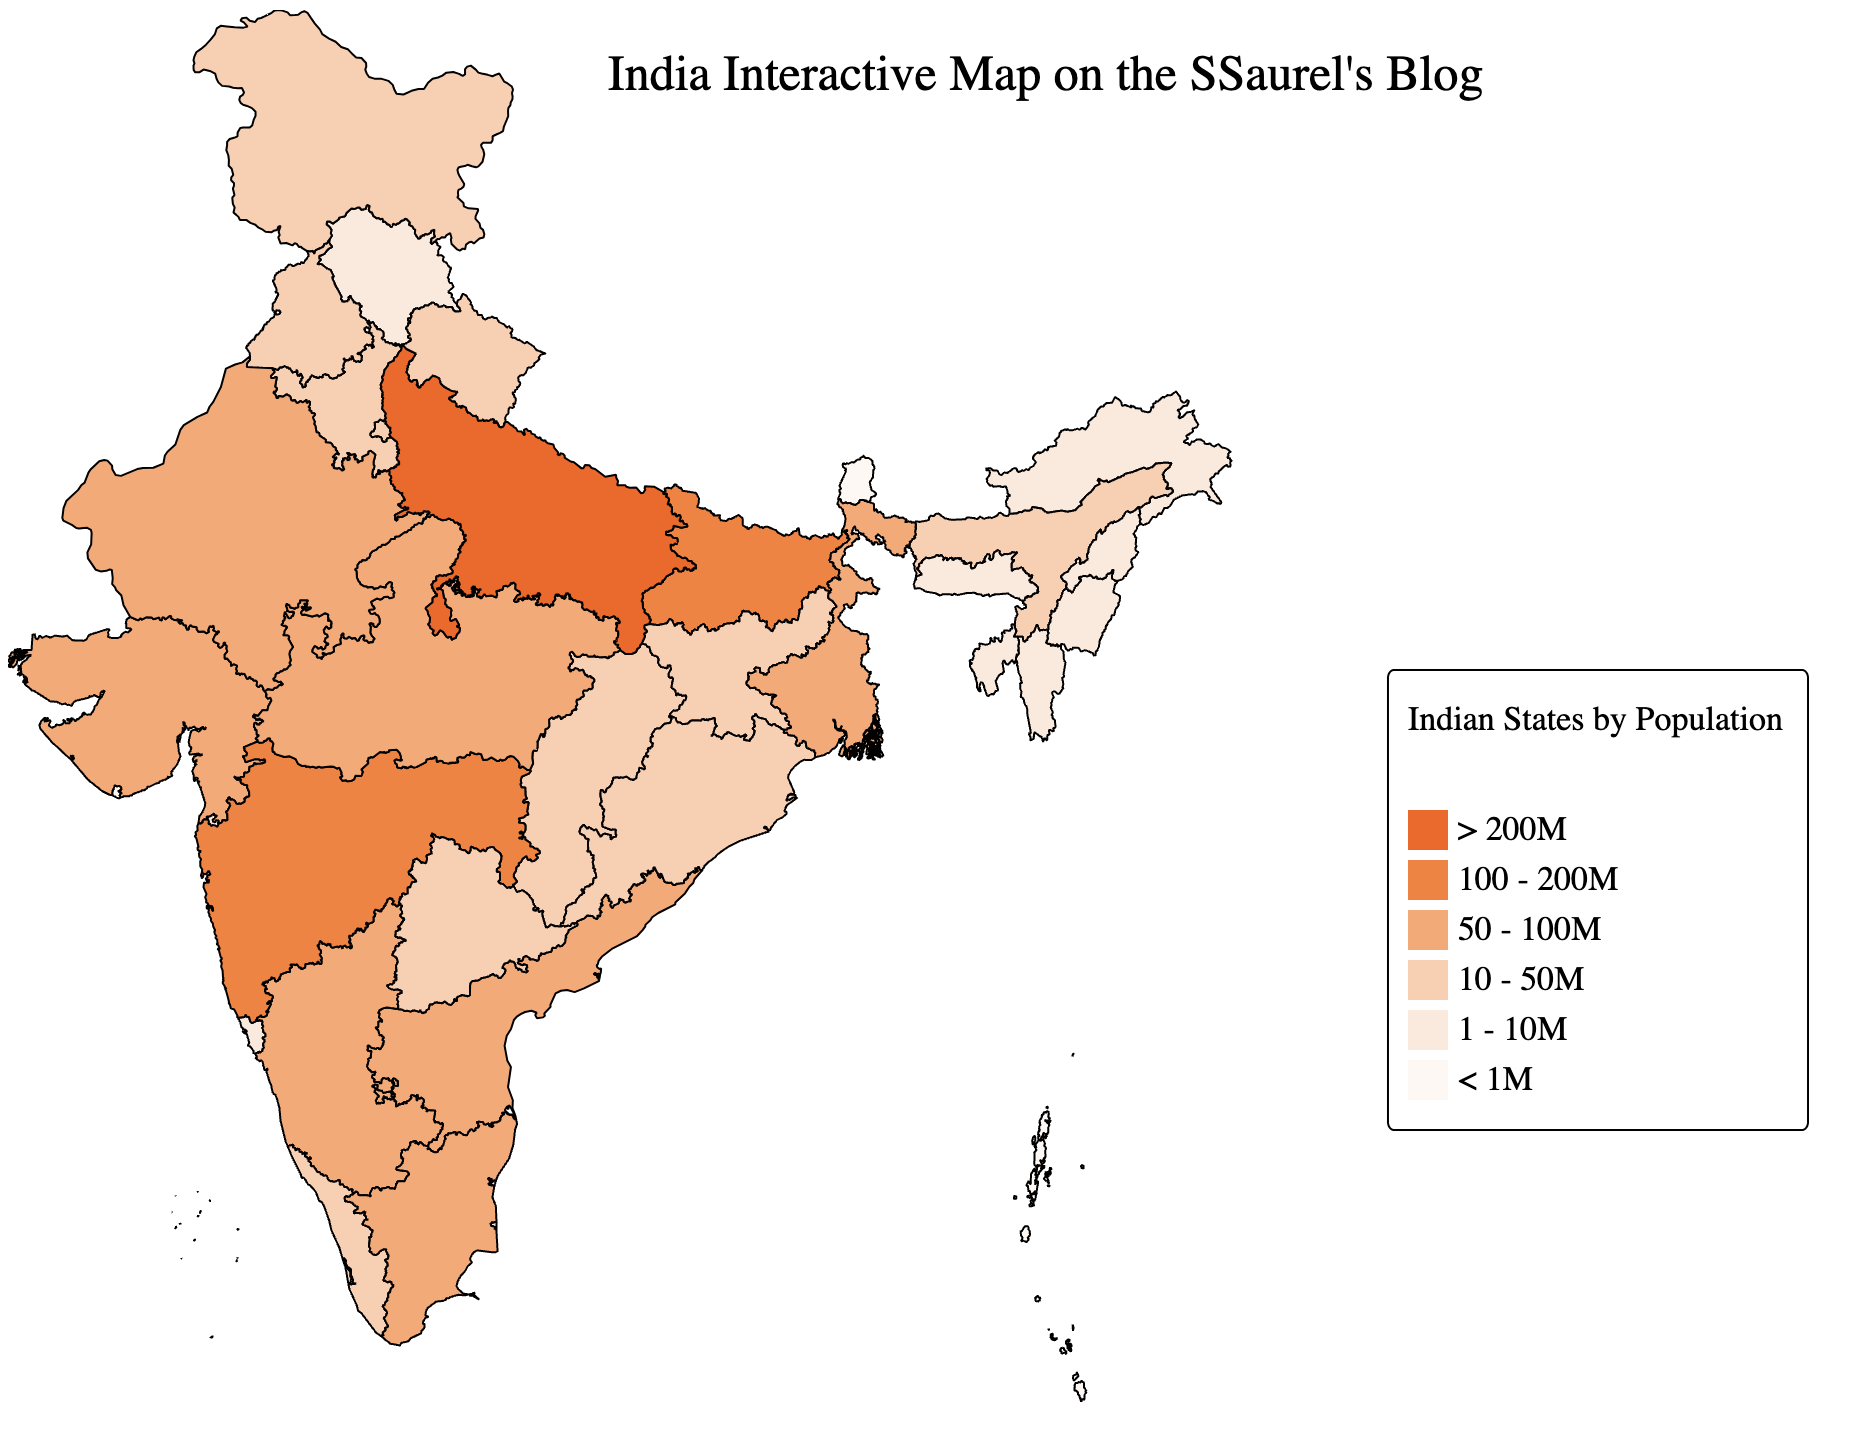
The next step is to add interactivity to our map of India in SVG format. Interactivity on the Web means JavaScript. So I’m going to do two essential things in this part of the tutorial.
The first will be to apply the right colors to each region of India according to the number of inhabitants in those regions. To be able to manipulate each path associated with a region of India in our SVG, I’m going to use the ids defined.
This is classic if you’re developing on the Internet.
The second thing to do will be to react to the user’s mouse-over on a region of India. To do this, I’ll iterate over each SVG path and add mousemove and mouseout event listeners. When the mouse is moved, I’ll display a tooltip that I’ll hide when the mouse leaves the region.
As you can see, I need to update my SVG by adding a rectangle and a text element, which will initially be hidden. Their visibility will only be activated when the user’s mouse hovers over a path in our SVG.
This gives us the following complete code for our Web page displaying an interactive SVG map of India:
Now let’s see what happens when we move the mouse over India’s most densely populated region: Uttar Pradesh.
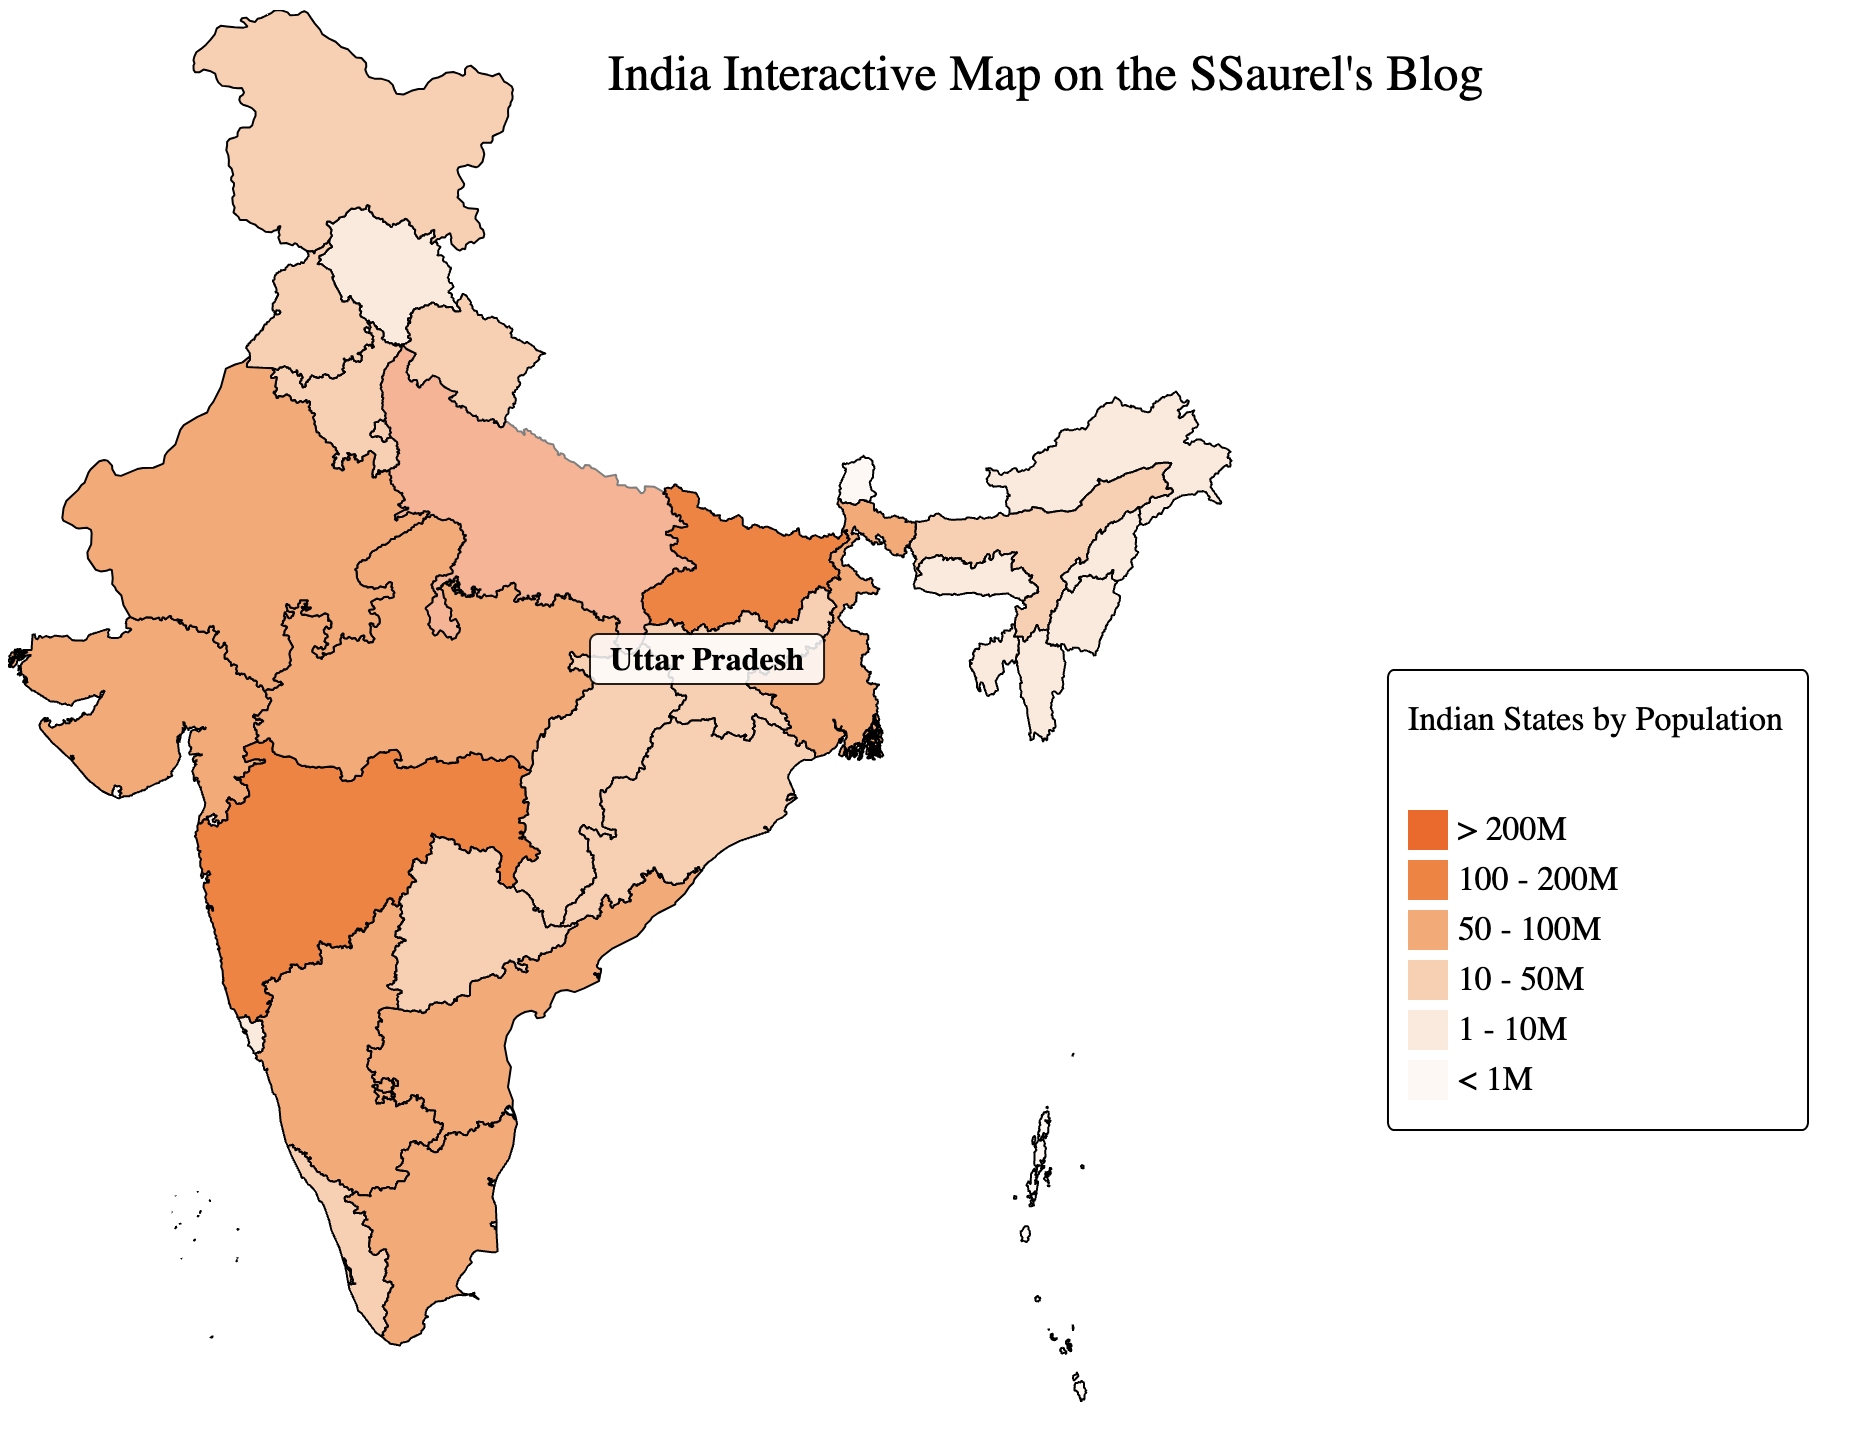
The key part of the code of our HTML page to display this tooltip is located here:


Leave a Reply
You must be logged in to post a comment.