Create a real time line graph in Android with GraphView
In Android applications, there are a lot of use cases in which you must create graphs. Fortunately, a lot of open source libraries exist letting you to easily create line graphs, bar graphs or other style of graphs. These libraries have the main advantages to be designed entirely for Android and so, they are optimized.
Among the main libraries, we’re going to try three of them :
- GraphView
- AChartEngine
- MP Android Chart
To test these libraries, we’re going to try to create a real time graph in Android. In this first article, we’re going to use GraphView.
GraphView is an open source library available on GitHub : https://github.com/jjoe64/GraphView
GraphView has also an interesting website with a great documentation : http://www.android-graphview.org
In this tutorial, we use Eclipse so we must download the library as a jar file in version 4.0.0 and add it in libs folder of our Android application project. First step is to add the GraphView in a layout XML file :
<RelativeLayout xmlns:android="http://schemas.android.com/apk/res/android"
  xmlns:tools="http://schemas.android.com/tools"
  android:layout_width="match_parent"
  android:layout_height="match_parent"
  android:paddingBottom="@dimen/activity_vertical_margin"
  android:paddingLeft="@dimen/activity_horizontal_margin"
  android:paddingRight="@dimen/activity_horizontal_margin"
  android:paddingTop="@dimen/activity_vertical_margin"
  tools:context="com.ssaurel.testgraphview.MainActivity" >

  <!-- we add graph view to display -->
  <com.jjoe64.graphview.GraphView
    android:id="@+id/graph"
    android:layout_width="match_parent"
    android:layout_height="300dp" />

</RelativeLayout>
Then, we can use it in an Activity like this :
package com.ssaurel.testgraphview;

import java.util.Random;

import android.app.Activity;
import android.os.Bundle;

import com.jjoe64.graphview.GraphView;
import com.jjoe64.graphview.Viewport;
import com.jjoe64.graphview.series.DataPoint;
import com.jjoe64.graphview.series.LineGraphSeries;

public class MainActivity extends Activity {

  private static final Random RANDOM = new Random();
  private LineGraphSeries<DataPoint> series;
  private int lastX = 0;

  @Override
  protected void onCreate(Bundle savedInstanceState) {
    super.onCreate(savedInstanceState);
    setContentView(R.layout.activity_main);
    // we get graph view instance
    GraphView graph = (GraphView) findViewById(R.id.graph);
    // data
    series = new LineGraphSeries<DataPoint>();
    graph.addSeries(series);
    // customize a little bit viewport
    Viewport viewport = graph.getViewport();
    viewport.setYAxisBoundsManual(true);
    viewport.setMinY(0);
    viewport.setMaxY(10);
    viewport.setScrollable(true);
  }

  @Override
  protected void onResume() {
   super.onResume();
   // we're going to simulate real time with thread that append data to the graph
   new Thread(new Runnable() {

     @Override
     public void run() {
       // we add 100 new entries
       for (int i = 0; i < 100; i++) {
         runOnUiThread(new Runnable() {

           @Override
           public void run() {
             addEntry();
           }
         });

         // sleep to slow down the add of entries
         try {
           Thread.sleep(600);
         } catch (InterruptedException e) {
           // manage error ...
         }
       }
     }
    }).start();
   }

   // add random data to graph
   private void addEntry() {
     // here, we choose to display max 10 points on the viewport and we scroll to end
     series.appendData(new DataPoint(lastX++, RANDOM.nextDouble() * 10d), true, 10);
   }

}
In this code, we get GraphView instance defined in the layout file. Then, we define data that will be displayed thanks to LineGraphSeries class. So, we choose to display a line graph. Each data is designed inside a DataPoint class. Method addEntry lets to add new entries to graph’s data.
To simulate real time data addition, we create a thread that add data to the LineGraphSeries dataset and then we make a sleep in the thread. To update UI state in the UI thread, we put the addEntry call in a runOnUiThread method.
Result is here :
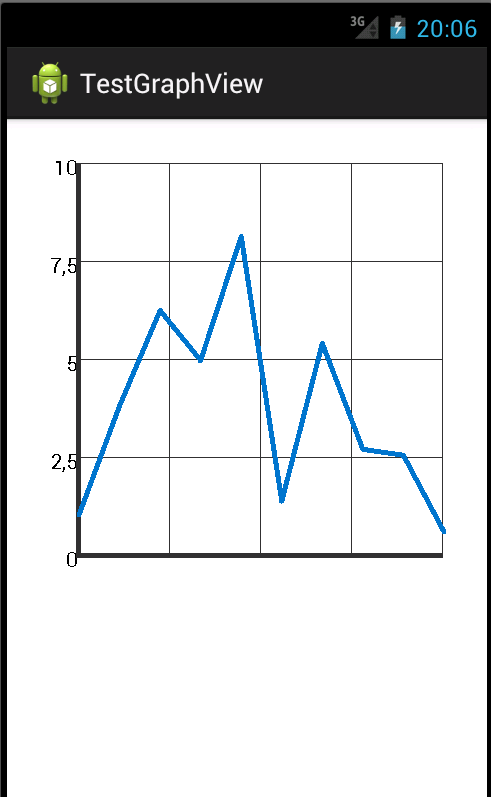
Thanks to GraphView, we have created a real time line graph on Android. However, if result works well, the rendering is not very beautiful. We will try to get a better rendering with AChartEngine or MP Android Chart in next tutorials.
You can also check this Youtube video that show live coding of this tutorial :


Leave a Reply
You must be logged in to post a comment.